On April 13, 2017, the Wisconsin Assembly Committee on College and Universities held an informational hearing on outcomes-based funding for higher education. The video of the entire hearing is available here. Below are the notes from my testimony, including appendices with additional information.
1. Preliminaries
When approaching PBF/OBF, I think first about the underlying problem to be solved and how PBF gives policymakers the levers to solve them. This approach will hopefully help us avoid predictable pitfalls and maximize the odds of making a lasting and positive difference in educational outcomes.
- What is the underlying problem to be solved/goal to be achieved?
- Some possibilities:
- Increase number degrees awarded (see Appendix A)
- Tighten connection between high school and college
- Close inequalities in graduation rates
- Improve affordability and debt burdens
- Improve transparency and accountability for colleges
- All of the above, plus more?
- What policy levers does PBF/OBF offer for solving these problems?
- Financial incentives: 2% of UWS annual budget; millions for campuses
- Persuasive communication: transparency and focusing of goals
- Capacity building: technical and human resources to perform
- Routines of learning: system-wide network of best practices, data sharing
- What can we learn from outside higher education?
- Pay-for-performance should work when:
- Goals are clearly measured
- Tasks are routine and straightforward
- Organizations are specialized, non-complex
- Employees are not motivated
- Outcomes are immediately produced
- But efforts rarely produce large or sustained effects:
- K-12
- Job training
- Crime & policing
- Public health
- Child support
- We are left with a conundrum where the policy is spreading but without convincing or robust evidence that it has improved outcomes: PBF/OBF states have not yet out-performed others.
- Political success versus programmatic success.
2. Overview of higher education PBF/OBF research
Disentangling the effect of the policy from other noise is challenging, but possible. I have produced some of this research and am the first to say it’s the collection of work – not a single study – that can explain what is happening. Here is a quick overview of the academic evaluations that adhere to social science standards, passed peer review, and are published in the field’s top research journals.
- What are the biggest challenges to doing research in this area?
- Treatment vs. dosage
- New vs. old models
- Secular trend vs. policy impact
- Lags and implementation time
- Intended vs. unintended outcomes
- What has the research found?
- Older studies
- Documenting which states and when (1990-2010)
- Focus on AAs and BAs
- No average effects
- Small (0.01 SD) lagged effect for BA degrees (PA)
- Small (0.04 SD) lagged effects for AA (WA)
- Newer studies
- Institution-level and state case studies
- Focus on retention, certificates, AAs, BAs, and resource allocation
- Account for implementation lags and outcome lags
- Differentiates old from new models
- No average effects
- No effect on graduation rates
- No effect on BA even with lags (PASSHE, OH, TN, IN)
- No effect on retention or AA (WA, OH, TN)
- Modest change in internal budget, research vs instruction
- Negative effects
- Sharp increase in short-term certificates (WA, TN)
- Reduced access for Pell and minority students (IN)
- Less Pell Grant revenue
3. Pros and cons
- Despite these findings, there is still an appetite for adopting and expanding PBF/OBF in the states and for good reason:
- Focus campus attention on system-wide goals
- Increases public transparency
- Helps stimulate campus reform efforts
- Remedial education reform
- Course articulation agreements
- More academic advisors, tutors, etc.
- But pursuing this course of action has significant costs that should be considered and avoided to the fullest extent possible:
- Transaction costs: new administrative burdens for campuses
- Goal displacement: trades research for teaching, weaker standards
- Strategic responses: gaming when tasks are complex and stakes are high
- Democratic responsiveness: formula, not legislators, drive the budget
- Negativity bias: focus on failures over successes, can distract attention
4. Recommendations
If I were asked to design a PBF/OBF system for the state, I would adhere to the following principles. These are guided by the most recent and rigorous research findings in performance management and higher education finance:
- Use all policy instruments available to maximize chances of success.
- Financial capacity (e.g., instructional expenses and faculty-student ratio) is the strongest predictor of time-to-degree, so reinvestment will likely yield greatest results regardless of funding model
- Analytical capacity and data infrastructure needs to be built, used, and sustained over time to make the most of the performance data generated by the new model
- Invest in system’s capacity to collect, verify, and disseminate data (see Missouri’s Attorney General’s recent audit)
- Build campus’ technical and human resource capacity before asking campuses to reach specific goals (Appendix B has promising practices).
- Avoid one-size-fits-all approaches by differentiating by mission, campus, and student body.
- Different metrics per campus
- Different weights per metric
- Input-adjusted metrics
- Hold-harmless provisions to navigate volatility
- Use prospective, rather than retrospective, metrics to gauge progress and performance on various outcomes.
- Consider developing an “innovation fund” where campuses submit requests for seed funding allowing them to scale up or develop promising programs/practices they currently do not have capacity to implement.
- Use growth measures rather than peer-comparisons, system averages, or rankings when distributing funds.
- Monitor and adjust to avoid negative outcomes and unintended results.
- Engage campuses and other stakeholders in developing and designing performance indicators. Without this, it is unlikely for PBF/OBF to be visible at the ground-level and to be sustained over political administrations.
- Create a steering committee to solicit feedback, offer guidance, and assess progress toward meeting system PBF/OBF goals.
- See Appendix C for questions this group could help answer.
Appendix A:
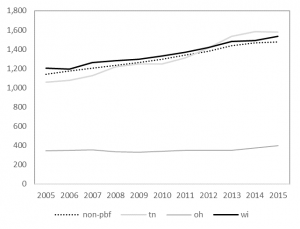
On average, PBF/OBF states have not yet outperformed non-PBF/OBF states in terms of degree completions. To the extent they have, the effects are isolated in short-term certificate programs, which do not appear to lead to associate’s degrees and that (on average) do not yield greater labor market returns than high school diplomas.
Figure 1:
Average number of short-term certificates produced by community/technical colleges
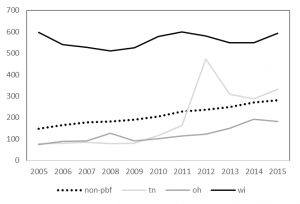
Figure 2:
Average number of long-term certificates produced by community/technical colleges
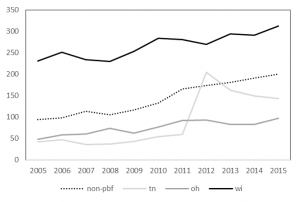
Figure 3:
Average number of associate’s degrees produced by community/technical colleges
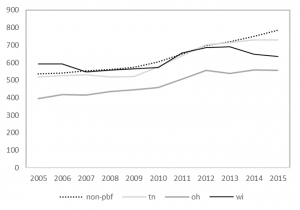
Figure 4:
Average number of bachelor’s degrees produced by public research universities
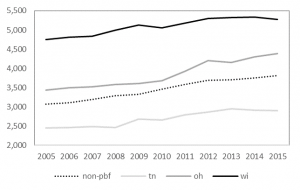
Figure 5:
Average number of bachelor’s degrees produced by public masters/bachelor’s universities
Appendix B:
While there are many proposed ideas to improve student outcomes in higher education, most are not evidence-based. This policy note identifies practices where there is a strong evidence base for what works, based on the high-quality, recent and rigorous research designs.
- Investment in instructional expenditures positively impacts graduation rates.[i] Reducing instructional resources leads to larger class sizes and higher faculty-to-student ratios, which is a leading reason why students take longer to earn their degrees today.[ii] When colleges invest more in instruction, their students also experience more favorable employment outcomes.[iii] There may be cost-saving rationales to move instruction to online platforms, but this does not improve student outcomes and often results in poorer academic performance primarily concentrated among underrepresented groups.[iv]
- Outside the classroom, student support services like advising, counseling, and mentoring are necessary to help students succeed.[v] Recent studies have found retention and graduation rates increase by both intensive and simpler interventions that help students stay on track.[vi] Interventions that help students navigate the college application and financial aid process have a particularly strong evidence base of success.[vii]
- Need-based financial aid increases graduation rates by approximately 5 percentage points for each $1,000 awarded.[viii] When students receive aid, they attempt and complete more credit hours, work fewer hours, and have even more incentives to persist through graduation.[ix] Coupling financial aid with additional student support services (e.g., individualized advising) yields even stronger outcomes, [x] particularly among traditionally underrepresented students.[xi] When tuition rises without additional aid, students are less likely to enroll and persist and these effects again disproportionately affect underrepresented students.[xii]
- Remedial coursework slows students’ progress toward their degree, but does not necessarily prevent them from graduating. Remedial completers often perform similar to their peers and these leveling effects are strongest for the poorest-prepared students.[xiii] High school transcripts do a better job than placement exams in predicting remediation success,[xiv] and some positive effects may come via changing instructional practices and delivering corequisite remedial coursework.[xv] But even without reforming remediation, enhanced academic and financial support services have been found to greatly improve remedial completion and ultimately graduation rates.[xvi]
- Place-based College Promise programs guarantee college admission and tuition waivers for local high school students. There are more than 80 programs operating nationwide with several across Wisconsin: Gateway College Promise, LaCrosse Promise, Milwaukee Area Technical College Promise, Milwaukee’s Degree Project, and Madison Promise.[xvii] Program evaluations in Kalamazoo, MI, and Knoxville, TN, find the programs have positive effects on college access, choice, and progress toward degree completion.[xviii]
Appendix C:
Below are additional questions to consider as legislators, regents, and system officials move forward in their planning efforts.
- What is the purpose of PBF and who are the most likely users of the data? Is it external accountability – implying the legislature or public will be the primary users? Or campus-driven improvement – implying campus administration will be the primary users?
- How is the data collected, verified, and reported? By whom and with what guidelines?
- How well does a metric measure what it sets out to measure? Are there key aspects of higher education that are not being measured?
- What technical and human resource capacity do campuses have to use this data? How?
- What unintended result might occur by prioritizing a particular metric over another?
- How might the numbers be gamed without improving performance or outcomes?
- Who on campus will translate the system’s performance goals into practice? How?
- When numbers look bad, how might officials respond (negativity bias)?
Endnotes
[i] Webber, D. A. (2012). Expenditures and postsecondary graduation: An investigation using individual-level data from the state of Ohio. Economics of Education Review, 31(5), 615–618.
[ii] Bound, J., Lovenheim, M. F., & Turner, S. (2012). Increasing time to baccalaureate degree in the United States. Education, 7(4), 375–424. Bettinger, E. P., & Long, B. T. (2016). Mass Instruction or Higher Learning? The Impact of College Class Size on Student Retention and Graduation. Education Finance and Policy.
[iii] Griffith, A. L., & Rask, K. N. (2016). The effect of institutional expenditures on employment outcomes and earnings. Economic Inquiry, 54(4), 1931–1945.
[iv] Bowen, W., Chingos, M., Lack, K., & Nygren, T. I. (2014). Interactive Learning Online at Public Universities: Evidence from a Six‐Campus Randomized Trial. Journal of Policy Analysis and Management, 33(1), 94–111.
[v] Castleman, B., & Goodman, J. (2016). Intensive College Counseling and the Enrollment and Persistence of Low Income Students. Education Finance and Policy.
[vi] Bettinger, E. P., & Baker, R. B. (2014). The Effects of Student Coaching An Evaluation of a Randomized Experiment in Student Advising. Educational Evaluation and Policy Analysis, 36(1), 3–19.
[vii] Bettinger, E. P., Long, B. T., Oreopoulos, P., & Sanbonmatsu, L. (2012). The Role of application assistance and information in college decisions: results from the H&R Block FAFSA experiment. The Quarterly Journal of Economics, 127(3), 1205–1242.
[viii] Castleman, B. L., & Long, B. T. (2016). Looking beyond Enrollment: The Causal Effect of Need-Based Grants on College Access, Persistence, and Graduation. Journal of Labor Economics, 34(4), 1023–1073. Scott-Clayton, J. (2011). On money and motivation: a quasi-experimental analysis of financial incentives for college achievement. Journal of Human Resources, 46(3), 614–646.
[ix] Mayer, A., Patel, R., Rudd, T., & Ratledge, A. (2015). Designing scholarships to improve college success: Final report on the Performance-based scholarship demonstration. Washington, DC: MDRC. Retrieved from http://www.mdrc.org/sites/default/files/designing_scholarships_FR.pdf Broton, K. M., Goldrick-Rab, S., & Benson, J. (2016). Working for College: The Causal Impacts of Financial Grants on Undergraduate Employment. Educational Evaluation and Policy Analysis, 38(3), 477–494.
[x] Page, L. C., Castleman, B., & Sahadewo, G. A. (Feb. 1, 2016). More than Dollars for Scholars: The Impact of the Dell Scholars Program on College Access, Persistence and Degree Attainment. Persistence and Degree Attainment.
[xi] Angrist, J., Autor, D., Hudson, S., & Pallais, A. (2015). Leveling Up: Early Results from a Randomized Evaluation of Post-Secondary Aid. Retrieved from http://economics.mit.edu/files/11662
[xii] Hemelt, S., & Marcotte, D. (2016). The Changing Landscape of Tuition and Enrollment in American Public Higher Education. The Russell Sage Foundation Journal of the Social Sciences, 2(1), 42–68.
[xiii] Bettinger, E. P., Boatman, A., & Long, B. T. (2013). Student supports: Developmental education and other academic programs. The Future of Children, 23(1), 93–115. Chen, X. (2016, September 6). Remedial Coursetaking at U.S. Public 2- and 4-Year Institutions: Scope, Experiences, and Outcomes. Retrieved from https://nces.ed.gov/pubsearch/pubsinfo.asp?pubid=2016405
[xiv] Scott-Clayton, J., Crosta, P. M., & Belfield, C. R. (2014). Improving the Targeting of Treatment: Evidence From College Remediation. Educational Evaluation and Policy Analysis, 36(3), 371–393. Ngo, F., & Melguizo, T. (2016). How Can Placement Policy Improve Math Remediation Outcomes? Evidence From Experimentation in Community Colleges. Educational Evaluation and Policy Analysis, 38(1), 171–196.
[xv] Logue, A. W., Watanabe-Rose, M., & Douglas, D. (2016). Should Students Assessed as Needing Remedial Mathematics Take College-Level Quantitative Courses Instead? Educational Evaluation and Policy Analysis, 38(3), 578–598. Wang, X., Sun, N., & Wickersham, K. (2016). Turning math remediation into “homeroom”: Contextualization as a motivational environment for remedial math students at community colleges.
[xvi] Scrivener, S., Weiss, M. J., Ratledge, A., Rudd, T., Sommo, C., & Fresques, H. (2015). Doubling Graduation Rates: Three-Year Effects of CUNY’s Accelerated Study in Associate Programs (ASAP) for Developmental Education Students. Washington, DC: MDRC. Butcher, K. F., & Visher, M. G. (2013). The Impact of a Classroom-Based Guidance Program on Student Performance in Community College Math Classes. Educational Evaluation and Policy Analysis, 35(3), 298–323.
[xvii] Upjohn Institute. (2016). Local Place-Based Scholarship Programs. Upjohn Institute. Retrieved from http://www.upjohn.org/sites/default/files/promise/Lumina/Promisescholarshipprograms.pdf
[xviii] Carruthers, C. & Fox, W. (2016). Aid for all: College coaching, financial aid, and post-secondary persistence in Tennessee. Economics of Education Review, 51, 97–112. Andrews, R., DesJardins, S., & Ranchhod, V. (2010). The effects of the Kalamazoo Promise on college choice. Economics of Education Review, 29(5), 722–737.


