Each Friday, the US Department of Education publishes FAFSA filing data for all high schools in the country. We have been using this data to examine trends in filing, both for prior cycles and the the current (2017-18) cycle.
Last Friday, we presented at the AEFP conference or working paper (here) on filing rates and we thought it would be fun to throw in a slide on the new data that was released earlier that morning. We wanted to do that because it was the first look at filing since the IRS and Department of Education suspended the Data Retrieval Tool (DRT) on March 3rd. This tool made it easier for filers to import their tax records, which in turn should help students complete the form and reduce the need for verification.
In that presentation we shared the following slide, saying the dip corresponded with the DRT suspension.
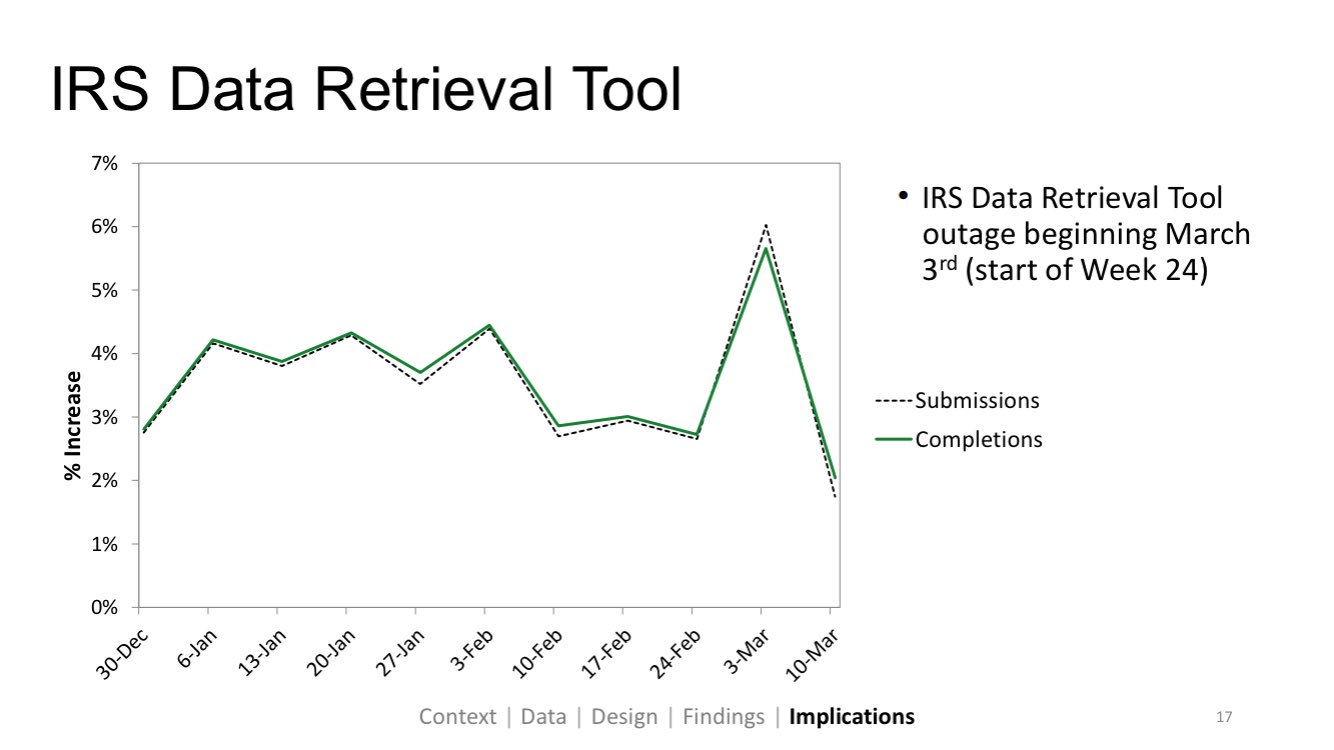
In our discussion and in the following conversations, we pointed out that some states have March deadlines that could be behind the spike and drop we see here. Attendees at the session also noted that the drop could simply be a result of secular trends, rather than the tool being unavailable. This is what we loved so much about the conference — we could puzzle together on an ongoing policy issue and we could discuss appropriate research designs for disentangling secular trends from the “treatment” effect.
I am still in conference mode, so I was eager to follow up on this when I returned home. Here is a quick look at those secular trends comparing states with early March deadlines (CA, ID, IN, MD, MI, OR, WV) to all other states.
This chart is a little hard to read, but the left shows last year’s cycle and the right is this year’s. We’re looking at the week-to-week percentage point change in FAFSA completions among high school seniors.
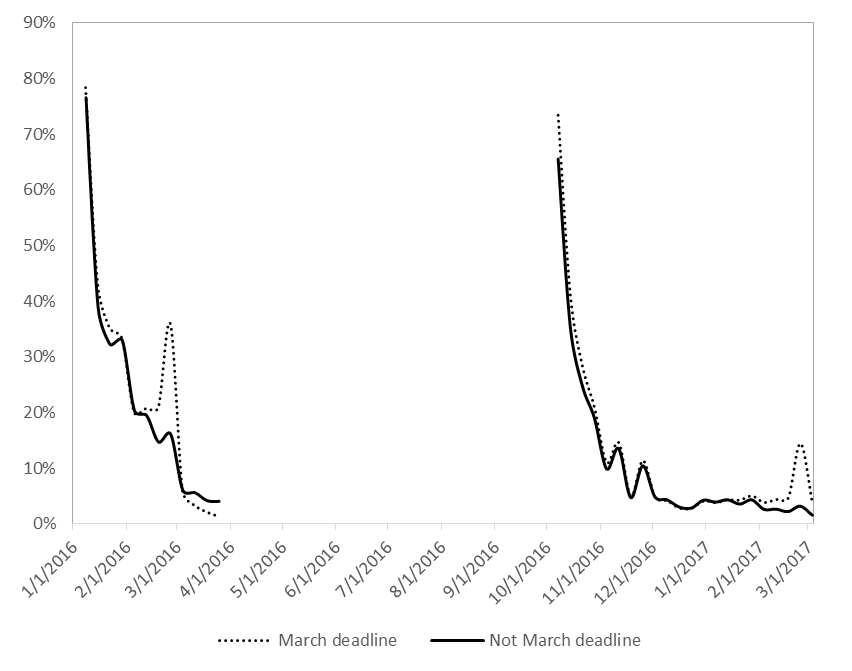
The dotted line represents states with early March filing dates, and sure enough we see the early-March spike in both cycles. And, as expected, we don’t see that spike in other states.
But notice one thing: the weekly trends show much steeper changes than this year’s cycle. This is because last year was much more condensed and this year is spread out over three additional months.
The March spike last year went from 21% to 36%, a 14 percentage point bump in a single week! This year, the bump is much smaller, but it is still large relative to other weeks: a 9 ppt bump.
I wanted to show these big picture trends just to get the complete cycle in our minds. But this is hard to see in the above chart, so let’s zoom in.
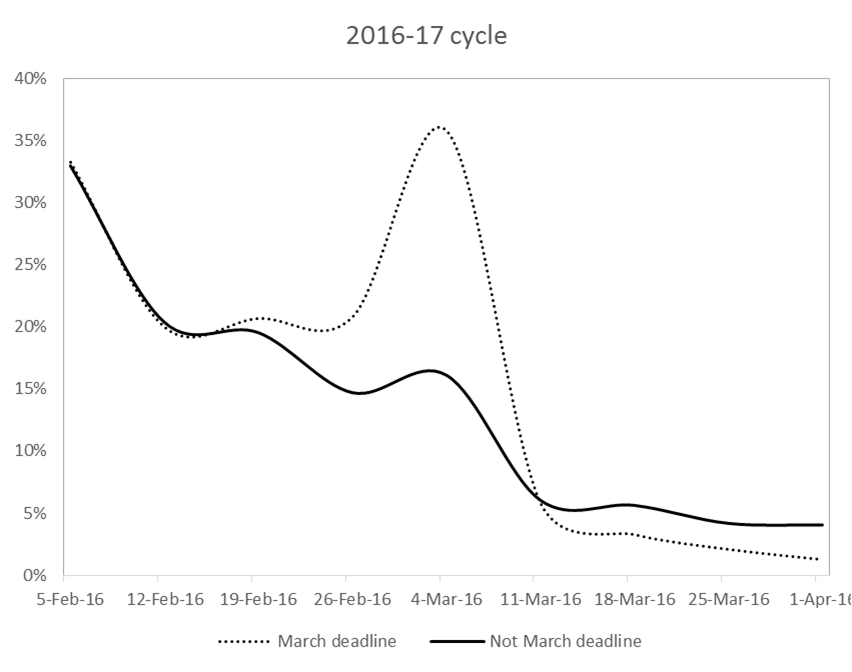
We see the steep weekly declines in the 2016-17 cycle, where “early March” states basically flat-line by the end of the month. And the other states slow down to about 5 percent growth rates through April.
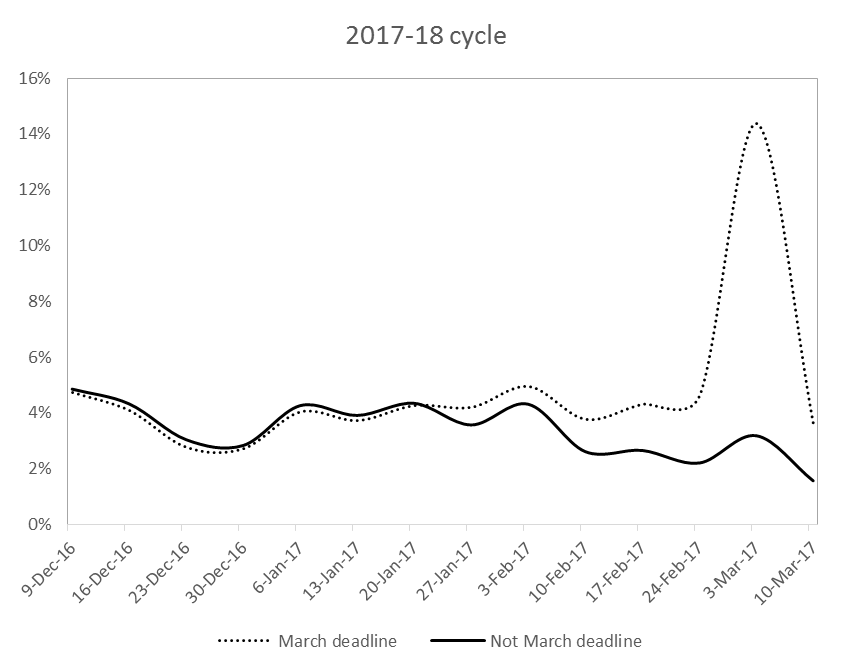
In the 2017-18 cycle, we still see that spike and we can anticipate the “early March” states will flat-line in the coming weeks. But it looks like the weekly trend holds pretty steady from week to week, hovering around 4 percent until February when it dips down to 2 percent.
[Side note: Look at the holiday season dip here, where filing drops in December. It does the same around Thanksgiving in the other chart above.]
The DRT suspension occurred on March 3rd, which likely had little to no effect on “early March” states so long as their deadlines were on March 1 or 2. But in the other states, we see March 10 (the week following the DRT suspension) reach its lowest point all cycle. The growth rate drops to 1.6% and we will monitor whether it rebounds in the coming weeks.
Considering that 1.78 million high school filers completed by June 30 last year, we have a long way to go to beat that level. We are currently at 1.62 million completions. That’s 160,000 a student gap that needs to be filled in 15 weeks. We can get there with a weekly growth rate less than 1 percent. We are already far above where we were last year in terms of completions, and I doubt weekly growth rates will slow below 1 percent. But this needs monitoring to be sure we’re on pace.
Whether the dip we saw this week was just part of the secular trend or whether it was because of the DRT suspension, we cannot say for sure with this descriptive analysis. We just wanted to share the data and bring this into the conversation. We don’t want to add noise or confusion to that conversation and we want to point out that it is hard to disentangle secular trends from the “treatment” effect. And that’s precisely why AEFP is a good conference to visit in order to share preliminary findings and to work through questions together.
We’ll keep monitoring this and piecing together as best of a picture as we can. Feedback welcome, as always!
Data:
| Early March states | Not early March states | |||
| Completed | Submitted | Completed | Submitted | |
| 2016-17 cycle | ||||
| January 8, 2016 | 30,515 | 36,605 | 104,872 | 125,304 |
| January 15, 2016 | 54,412 | 64,185 | 185,193 | 216,134 |
| January 22, 2016 | 77,754 | 91,606 | 257,083 | 299,213 |
| January 29, 2016 | 104,997 | 123,217 | 339,954 | 392,649 |
| February 5, 2016 | 139,918 | 163,356 | 451,996 | 518,168 |
| February 12, 2016 | 167,847 | 194,819 | 544,011 | 618,187 |
| February 19, 2016 | 202,543 | 234,077 | 650,209 | 736,784 |
| February 26, 2016 | 244,641 | 280,501 | 745,762 | 837,536 |
| March 4, 2016 | 332,235 | 383,092 | 865,845 | 967,066 |
| March 11, 2016 | 351,423 | 402,080 | 918,114 | 1,020,316 |
| March 18, 2016 | 362,821 | 412,751 | 969,787 | 1,074,355 |
| March 25, 2016 | 370,270 | 416,572 | 1,010,295 | 1,110,564 |
| April 1, 2016 | 374,809 | 420,089 | 1,051,186 | 1,152,268 |
| 2017-18 cycle | ||||
| October 7, 2016 | 36,760 | 41,943 | 159,976 | 180,256 |
| October 14, 2016 | 63,726 | 71,756 | 264,881 | 293,808 |
| October 21, 2016 | 89,957 | 101,377 | 359,001 | 396,507 |
| October 28, 2016 | 115,443 | 129,415 | 448,117 | 492,713 |
| November 4, 2016 | 139,479 | 155,856 | 533,215 | 584,646 |
| November 11, 2016 | 154,773 | 172,794 | 586,070 | 641,763 |
| November 18, 2016 | 177,266 | 197,186 | 665,354 | 726,252 |
| November 25, 2016 | 186,013 | 206,853 | 696,765 | 759,629 |
| December 2, 2016 | 207,066 | 229,919 | 769,497 | 837,037 |
| December 9, 2016 | 216,850 | 240,117 | 806,861 | 875,767 |
| December 16, 2016 | 225,690 | 249,402 | 841,780 | 912,144 |
| December 23, 2016 | 231,912 | 255,948 | 867,412 | 939,113 |
| December 30, 2016 | 238,191 | 262,747 | 892,013 | 965,228 |
| January 6, 2017 | 247,790 | 273,030 | 930,049 | 1,006,055 |
| January 13, 2017 | 256,997 | 282,662 | 966,455 | 1,045,077 |
| January 20, 2017 | 267,939 | 294,030 | 1,008,471 | 1,090,663 |
| January 27, 2017 | 279,177 | 305,858 | 1,044,504 | 1,127,559 |
| February 3, 2017 | 292,968 | 320,433 | 1,089,586 | 1,175,960 |
| February 10, 2017 | 303,994 | 332,054 | 1,118,125 | 1,204,642 |
| February 17, 2017 | 317,077 | 346,011 | 1,147,851 | 1,235,870 |
| February 24, 2017 | 331,670 | 361,602 | 1,173,191 | 1,262,285 |
| March 3, 2017 | 379,359 | 419,348 | 1,210,582 | 1,302,398 |
| March 10, 2017 | 392,864 | 430,926 | 1,229,581 | 1,320,855 |