Here is a quick visualization of the relationship between state higher education appropriations and net tuition revenue per full-time equivalent student from fiscal year 1980 to 2018.
The y-axis represents inflation-adjusted dollars per FTE based on SHEEO’s State Higher Education Finance data (here). The x-axis represents fiscal years; the solid black line is net tuition; the dotted line represents appropriations. 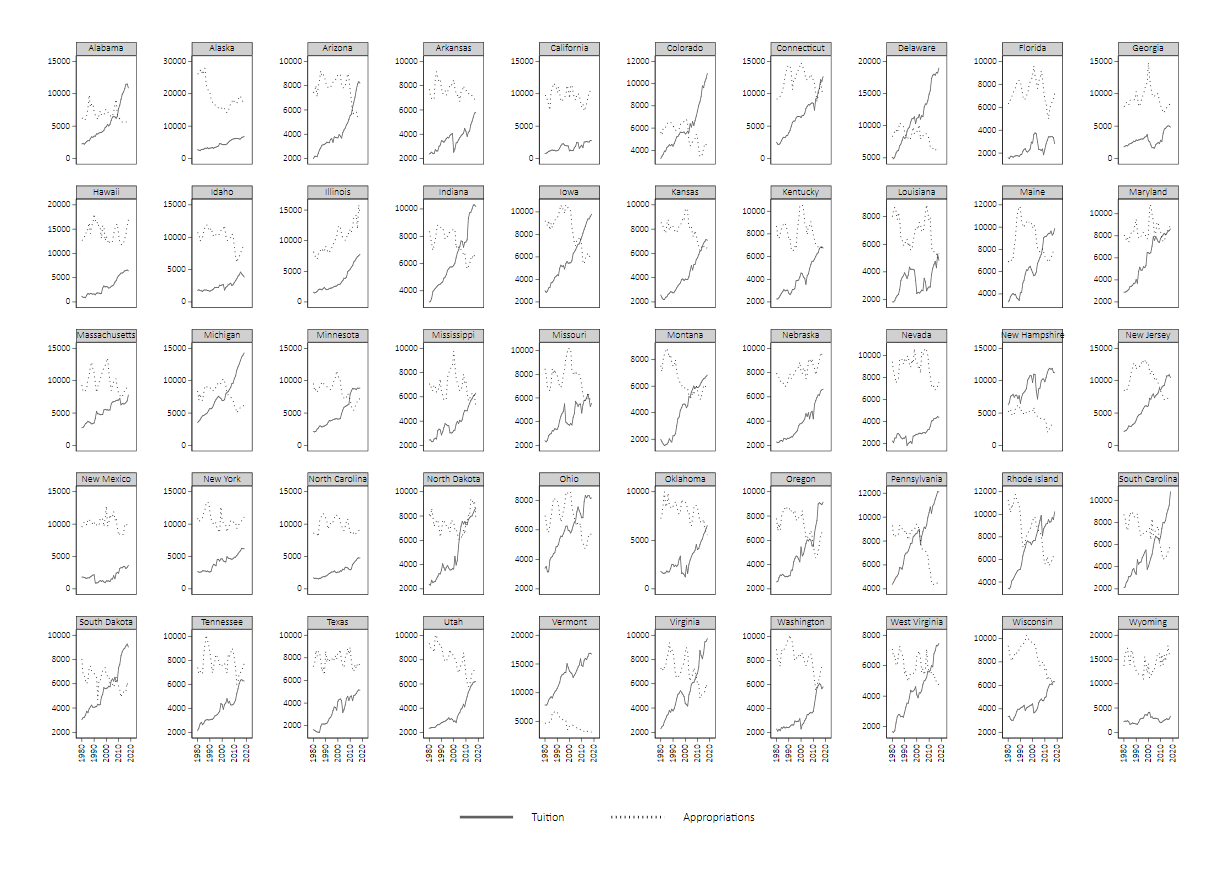
Please use, copy, and improve upon the Stata code pasted below to replicate these charts. This type of chart is a bit overwhelming, probably too much to squeeze into a small space, but it helps me see trends across multiple states. For example, I am squinting at the steady downward appropriation trends in Wisconsin that seems to have flattened out or even reversed direction in other Midwestern states over the past several years.
Thanks to the SHEEO team for making this data so easy to use. Stata code below:
// import data from SHEEO SHEF page
import excel https://sheeo.org/wp-content/uploads/2019/04/SHEEO_SHEF_FY18_Nominal_Data.xlsx, cellrange(A17:Q2016)
// trim data to focus on public appropriations, net tuition, and fte
keep A B E L N Q
rename A state
rename B fy
rename E heca_index
rename L ed_approp // state and local support less RAM
rename N net_tuition // net tuition less federal and state grants
rename Q fte // fte net medical students
// adjust for inflation using HECA
gen approp_adj = ed_approp / (heca_index/1)
gen tuit_adj = net_tuition / (heca_index/1)
// scale per fte
gen approp_fte = approp_adj/fte
gen tuit_fte = tuit_adj/fte
// table over time
table fy if state~=”US”, c(sum approp_adj sum tuit_adj sum fte) format(%15.0fc)
drop if inlist(state,”US”,”Washington DC”)
// lattice charts
* rescaled y axis
xtline tuit_fte approp_fte, i(state) t(fy) scheme(s1mono) byopts(rows(5) rescale note(“”)) xlabel(1980[10]2020,angle(vertical)) xtitle(“”) ymtick(none) ylabel(, nogrid angle(horizontal)) legend(size(tiny) region(lwidth(none)) label(1 “Tuition”) label(2 “Appropriations”) symxsize(6))
* fixed y axis
xtline tuit_fte approp_fte, i(state) t(fy) scheme(s1mono) byopts(rows(5) note(“”)) xlabel(1980[10]2020,angle(vertical)) xtitle(“”) ymtick(none) ylabel(0[5000]25000,nogrid angle(horizontal)) legend(size(tiny) region(lwidth(none)) label(1 “Tuition”) label(2 “Appropriations”) symxsize(6))