If you have ever looked for a way to get county-level unemployment rates for each county over time, there are probably a few ways to go about that task. Below is one way to do it in Stata.
This copies each file from 2000 through 2018, saves and cleans it to your local machine, and then stacks them all together in a panel format. I haven’t fully spot-checked, so please let me know if you see bugs.
Disclaimer: I have never figured out the whole Git Hub thing. I suspect if you’re reading this page there’s a good chance you haven’t either. So please don’t proselytize, just use this as a resource. WordPress doesn’t allow uploading .do files, but here’s what’s you could do:
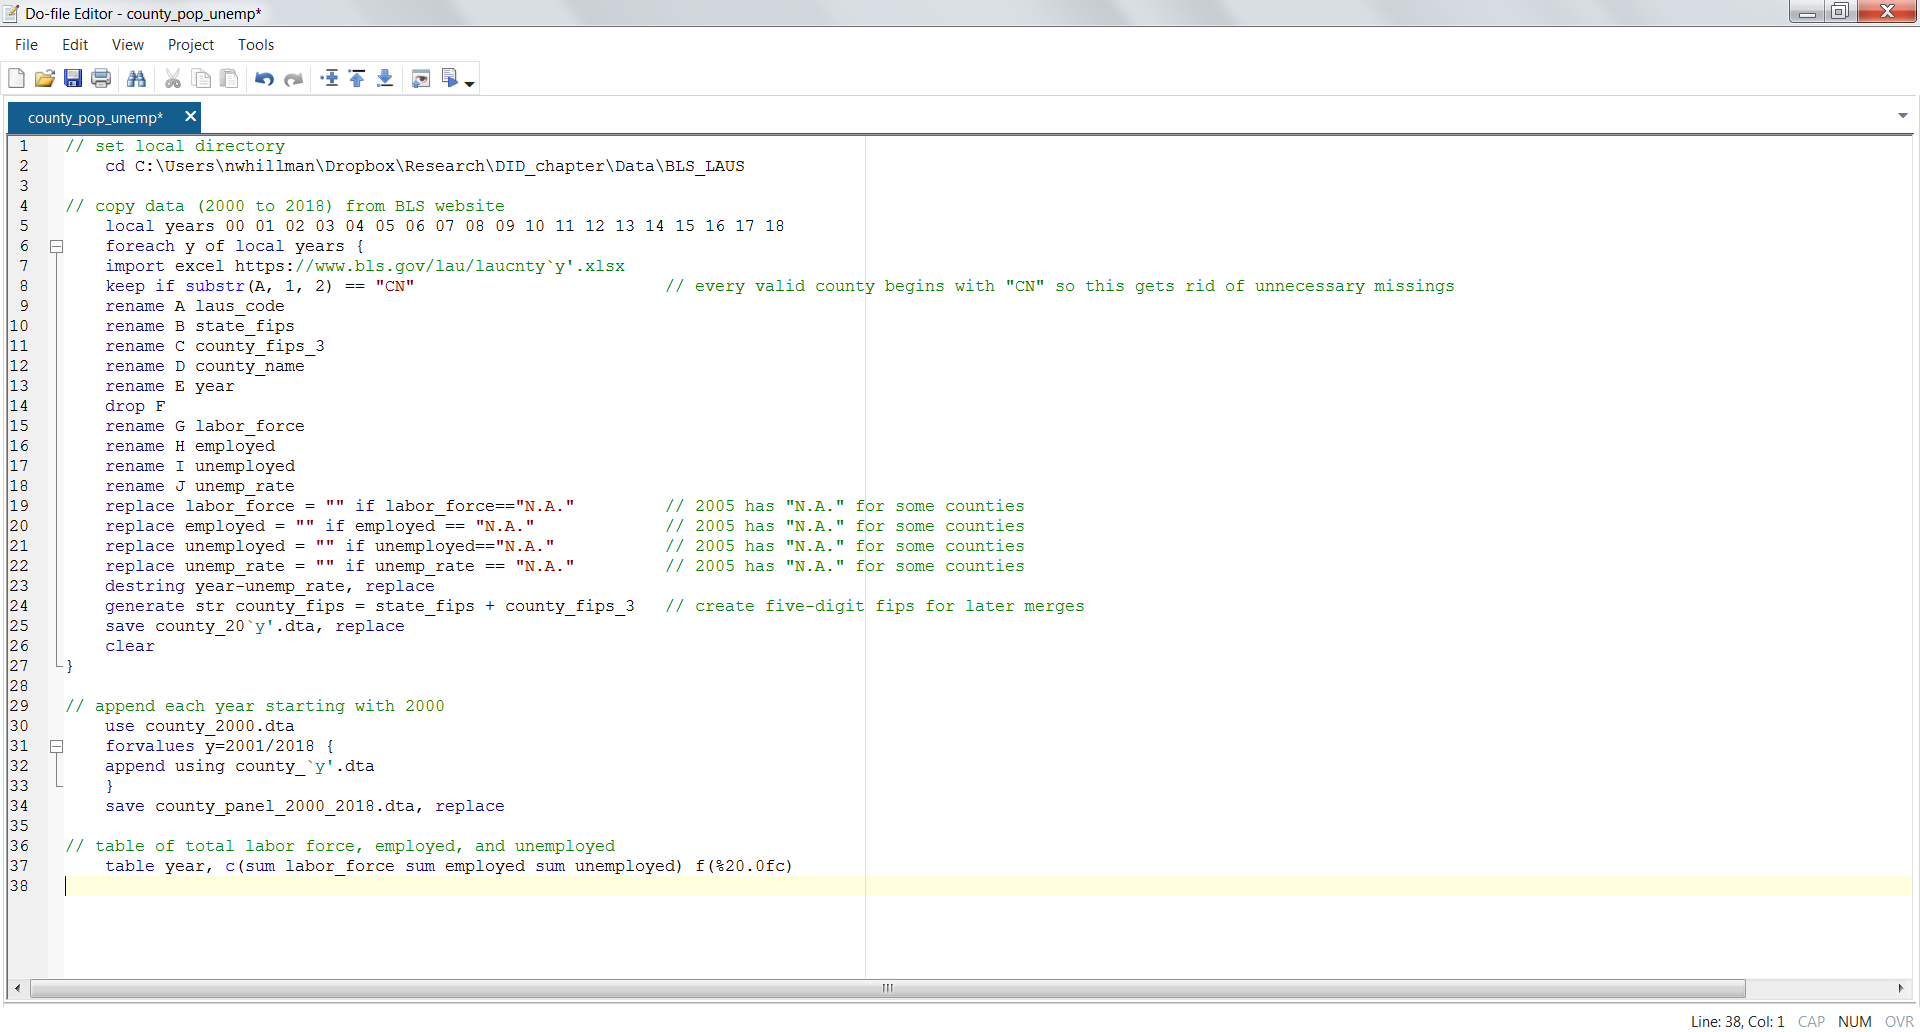
// set local directory
cd C:\Users\BLS_LAUS
// copy data (2000 to 2018) from BLS website
local years 00 01 02 03 04 05 06 07 08 09 10 11 12 13 14 15 16 17 18
foreach y of local years {
import excel https://www.bls.gov/lau/laucnty`y’.xlsx
keep if substr(A, 1, 2) == “CN”
rename A laus_code
rename B state_fips
rename C county_fips_3
rename D county_name
rename E year
drop F
rename G labor_force
rename H employed
rename I unemployed
rename J unemp_rate
replace labor_force = “” if labor_force==”N.A.”
replace employed = “” if employed == “N.A.”
replace unemployed = “” if unemployed==”N.A.”
replace unemp_rate = “” if unemp_rate == “N.A.”
destring year-unemp_rate, replace
generate str county_fips = state_fips + county_fips_3
save county_20`y’.dta, replace
clear
}
// append each year starting with 2000
use county_2000.dta
forvalues y=2001/2018 {
append using county_`y’.dta
}
save county_panel_2000_2018.dta, replace
// table of total labor force, employed, and unemployed
table year, c(sum labor_force sum employed sum unemployed) f(%20.0fc)