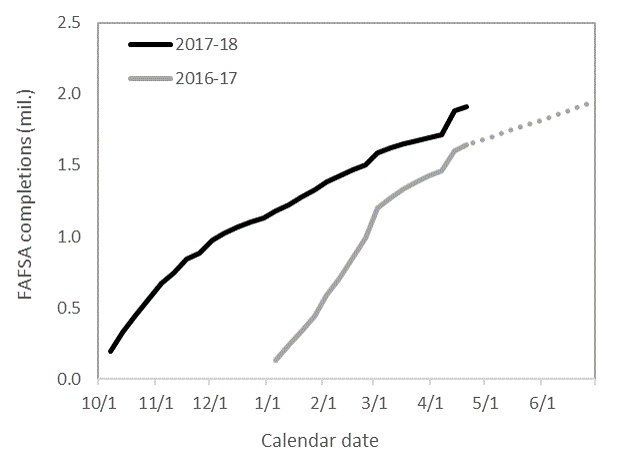
As of April 21, 2017, just over 1.9 million high school seniors completed the FAFSA. This is about 0.3 million more than at the same week last year, or a nice 15% bump. By the end of June last year, about 1.95 million students filed, so we’re on pace to surpass that number next month.
There is another bump worth keeping track of here. Beginning with the April 14 data release, the US Department of Education started counting 19 year old high school seniors. Prior to that week, all data represented 18 year olds.
On the upside, including 19 year olds now gives us a fuller picture of FAFSA filing. But on the downside, this affects our ability to consistently measure weekly changes for the full cycle. We’re hopeful the good folks at FSA will be able to run this data for 18 year olds and 19 years olds, separately, and we’ll provide updates accordingly.
This bump also occurred around the federal tax filing deadline, so it could also be driven in part by families filing the form when they did their taxes. We would be more likely to see that in last year’s cycle that didn’t have PPY, but we can’t disentangle all that here in our simple trend line. We’re just sharing our top-line trends in filing, see the raw data below:
| Week | Calendar | 2016-17 | 2017-18 |
| 1 | 10/1 | ||
| 2 | 10/7 | 196,736 | |
| 3 | 10/14 | 328,607 | |
| 4 | 10/21 | 448,958 | |
| 5 | 10/28 | 563,560 | |
| 6 | 11/4 | 672,694 | |
| 7 | 11/11 | 740,843 | |
| 8 | 11/18 | 842,620 | |
| 9 | 11/25 | 882,778 | |
| 10 | 12/2 | 976,563 | |
| 11 | 12/9 | 1,023,711 | |
| 12 | 12/16 | 1,067,470 | |
| 13 | 12/23 | 1,099,324 | |
| 14 | 12/30 | 1,130,204 | |
| 15 | 1/6 | 135,387 | 1,177,839 |
| 16 | 1/13 | 239,605 | 1,223,452 |
| 17 | 1/20 | 334,837 | 1,276,410 |
| 18 | 1/27 | 444,951 | 1,323,681 |
| 19 | 2/3 | 591,914 | 1,382,554 |
| 20 | 2/10 | 711,858 | 1,422,119 |
| 21 | 2/17 | 852,752 | 1,464,928 |
| 22 | 2/24 | 990,403 | 1,504,861 |
| 23 | 3/3 | 1,198,080 | 1,589,941 |
| 24 | 3/10 | 1,269,537 | 1,622,445 |
| 25 | 3/17 | 1,332,608 | 1,649,064 |
| 26 | 3/24 | 1,380,565 | 1,669,891 |
| 27 | 3/31 | 1,425,995 | 1,693,031 |
| 28 | 4/7 | 1,458,624 | 1,716,540 |
| 29 | 4/14 | 1,604,050 | 1,883,706 |
| 30 | 4/21 | 1,645,964 | 1,908,146 |