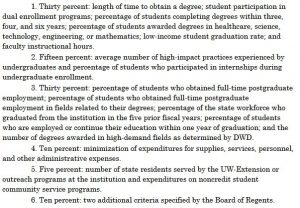
Governor Walker’s budget proposal would create a performance-based funding (PBF) system to allocate the $42.5 million in new money proposed for the 2017-19 biennium. There are six broad funding categories that generate 18 different metrics, depending how you want to count them:
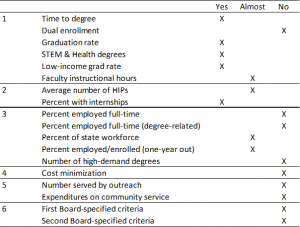
Only 5 of these 18 metrics are currently available in the University of Wisconsin System Accountability Dashboard:
- Length of time to obtain a degree
- Percentage of students completing degrees (within four and six years)
- Percentage of students awarded degrees in healthcare & STEM
- Low-income student graduation rate
- Percentage of students who participated in internships
The remaining 13 metrics are either unavailable in the Dashboard, or they are “almost” there. By “almost,” I mean there’s an alternative measure that is not quite the same as what is defined in the budget proposal.
Table 1: Mapping PBF indicators to Accountability Dashboard
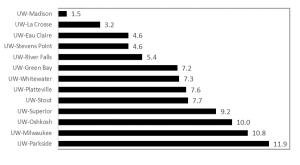
Using data from the Accountability Dashboard, I ranked each campus according to the five indicators in the “yes” column. Below is a summary of those results, showing the average rank across these five indicators.
Figure 1: Average rank on five key performance indicators
Across these five indicators, UW-Madison ranked at the top with an average rank of 1.5. Meanwhile, UW-Parkside ranked last with an average rank of 11.9 on these five. Notably, these five indicators would distribute between 30 and 40 percent of the total PBF allocation. It is possible, but I think unlikely, that calculations based on the other metrics would reverse these rankings (e.g., Parkside finishing first and Madison last).
Metric #1: Time-to-degree
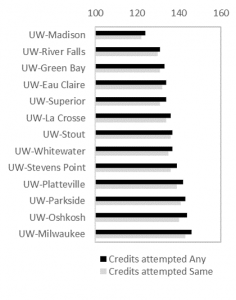
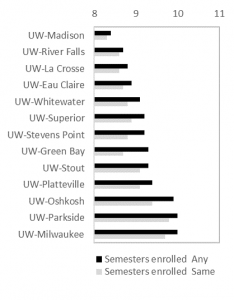
The Dashboard provides two ways to measure time-to-degree: credit hours attempted and semesters enrolled to graduation. In both cases, this metric follows cohorts of first-time, full-time students from the time they enter a UW System institution until graduation (in 2015-16). Not all students stay at the same college for their entire academic career, so this data is broken down for those who stay at the “same” college and those who ended up at “any” UW System university.
Figure 2: Credit hours attempted [left] and semesters to degree [right]
In each case, UW-Madison ranks first and UW-Milwaukee/UW-Parkside last. The choice of metric will matter in many cases. For example, UW-LaCrosse and UW-River Falls will tie if the Regents choose to use “semesters enrolled at the same institution,” but River Falls will rank higher than LaCrosse if completion at any campus is chosen. It is best to use “any institution” on this metric, given the magnitude of swirling and transferring that takes place in (and is encouraged by) systems of higher education.
Metric #2: Graduation rates
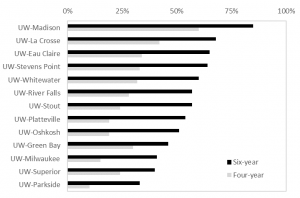
This metric follows each cohort of first-time, full-time students who begin college in a given academic year. Unlike the previous metric, this does not follow students who graduate from the “same” or from “any” UW institution. Instead, it only reports those who finish (within four or six years) at the same college where they began.
This metric is known as the Student Right to Know graduation rate metric, which under-counts the true graduation rate of public four-year universities by about 10 percentage points. Failing to account for transfer students or those who may were not first-time/full-time will play to the advantage of institutions enrolling “traditional” students (like UW-Madison). Adjusting this metric for open-access colleges and those serving post-traditional students would result in different and more accurate results that, in turn, will change the rank ordering.
Also note, the budget proposal calls for using three-year graduation rates, but this data is not reported in the Accountability Dashboard.
Metric #3: Share of degrees in Healthcare & STEM
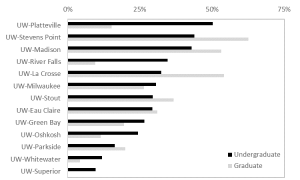
This metric is a bit more complicated than I initially expected. The budget proposal does not differentiate between undergraduate and graduate students, though the Dashboard does (fortunately). Similarly, it is unclear whether “STEM” should be measured separately from “Healthcare” — or whether they should be combined. For simplicity, I combined them below and differentiate between undergrad and grad:
If one were to rank colleges by undergraduate Healthcare & STEM (combined), then Platteville and Stevens Point come in first and second, respectively. But if it includes graduate students, then UW-Madison would take third and UW-LaCrosse second. It will be important for policymakers to clarify this metric since it is clear from the chart that rank orders will bounce around considerably depending on how this is measured.
Metric #4: Low-income student graduation rate
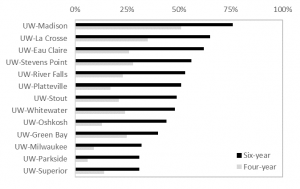
This metric is the same as Metric #2, but with an emphasis on Pell Grant recipients as the proxy for “low-income” (which is not without its own shortcomings). Nevertheless, using six-year graduation rates results in the same Top Four colleges as the other graduation rate metric. However, UW-Whitewater drops three places while UW-Platteville and UW-River Falls improve their rankings.
As a side note, I was impressed the Dashboard follows Pell graduation rates from the late 1970s, when the program was first created. This is a real treasure, as the federal government only recently began reporting Pell graduation rates in IPEDS. Kudos to the System data folks!
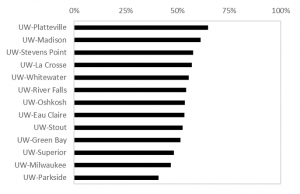
Metric #5: Percent doing internships
This metric is based on self-reported data from the National Survey of Student Engagement (NSSE). Here, UW-Platteville takes first place with having the highest share of seniors reporting they participated in an “internship or field experience.”
Technically, NSSE asks if students “participate in an internship, co-op, field experience, student teaching, or clinical placement.” And respondents can choose one of four options: done/in progress; plan to do; do not plan to do; or have not decided.
NSSE is not designed to be used in high-stakes accountability regimes like PBF. The main reason is that most of the variation in student responses occurs within (rather than between) campuses. Because of this, NSSE results are more useful for internal assessment and planning purposes and not for ranking colleges.
Other metrics not discussed here
There are 13 other metrics either not reported or “almost” reported in the Accountability Dashboard. In a future post, I’ll take a crack at the “almost” reported figures. For example, faculty instruction is reported in the Dashboard, but it only includes UW-Madison and UW-Milwaukee and then lumps together all other campuses in the system into a single “comprehensive” institution. Similarly, the average number of High Impact Practices (HIPs) is unavailable, but we can get the percentage of NSSE respondents experiencing at least one HIP. The percentage of Wisconsin’s workforce who graduated from a UW campus in the last five years (also an Act 55 reporting requirement) requires us to know the right denominator. But the Dashboard doesn’t tell us this: it only tells us the share of bachelor’s degree recipients living in the state (e.g., what if an alumni is out of the labor force; what age groups should be included; etc.?). Finally, it may be possible to use campus surveys to calculate the share of alumni working or continuing their education, but ideally this and several of the other workforce indicators would be answered via student unit record database rather than self-reported figures.
What’s next?
If approved in its current form, the Board of Regents would use these metrics to allocate PBF funds to campuses. The Board of Regents would also need to propose to the Department of Administration a plan for allocating PBF funds based on the rankings. For example, the plan would spell out exactly how much funding a campus will receive for getting 1st place on a particular metric…and how much (if any) will be allocated for those in last place.
The Regents need to figure this out and submit their plan to the Department of Administration by January 1, 2018, or in about 300 days from today. This obviously eats into the upcoming fiscal year, meaning all $42.5 million will be disbursed via PBF in 2018-19 (rather than $21.25 per year):
