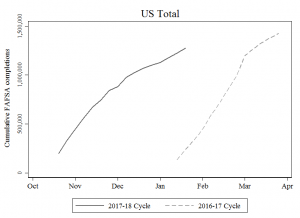
We are now 17 weeks into the 2017-18 FAFSA Cycle and about 1.27 million high school seniors have completed the form, according to FSA’s data.
Below is a chart comparing this cycle to last year’s (which began on Jan 1). We are far above where we were last January and about 150,000 behind where we were in April, when most states’ filing deadlines have passed. The solid black line will continue to slope upward, and when April comes we will be able to make a better comparison between the two cycles.
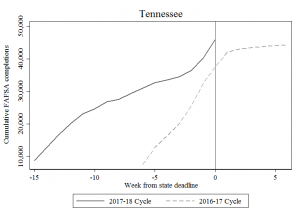
But in some states, we can already start to make preliminary comparisons since their filing deadlines have already passed. In Tennessee, for example, Jan 17 was the deadline for the Tennessee Promise program and we now have data that spans this deadline for both cycles (last year’s deadline was in February, so this chart shows “weeks from deadline” instead of calendar weeks).
In the current cycle, we see a sharper spike in the weeks leading up to the deadline, whereas last cycle was not quite as pronounced. Last year, the deadline was followed by a plateau, so we will be monitoring other states with deadlines to see whether similar patterns hold.
Regardless, nearly 50,000 Tennessee high school seniors filed the FAFSA this cycle compared to the nearly 38,000 who filed prior to last year’s deadline. This 12,000 differential is a large bump and likely due to a number of factors including greater awareness of the Tennessee Promise program, outreach efforts, the number of high school seniors, FAFSA changes, etc. We are unable to say with this data, but it sure is a promising trend to see!
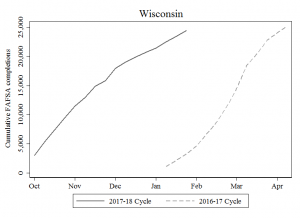
But several states do not have filing deadlines and instead use a first-come, first-serve basis for awarding financial aid. Wisconsin is one example and, unlike Tennessee, we do not see a surge in filing. Instead, we see more of a parallel filing trend that slowly converges.
Here 17 weeks into the current cycle, we have about the same number of filers as we saw last April (Week 14 of that cycle). In states without filing deadlines, we might expect to see flatter growth but we are unsure if this will plateau or steadily slow its growth rate until the FAFSA cycle ends.
We are thinking through the consequences of using hard (TN) versus soft (WI) filing deadlines and will eventually be able to see whether overall filing rates differ by state policy design. Maybe the won’t vary, but it’s worth a look!
For example, it seems possible a hard-deadline state should have higher overall filing rates since students may be more aware of the “use it or lose it” consequences of missing the deadline. But it is also possible hard-deadline states end up with lower overall filing rates for the exact same reason — students who miss the deadline may be out of luck and missing out will result in lower overall filing rates. We don’t know yet, and maybe we don’t detect any patterns, but this project is one step in that direction to dig into new areas of financial aid research.
Data:


