I have been digging into the new income mobility paper, just trying to wrap my head the details while not losing the forest for the trees. This is a remarkable study and the authors provide institution-level public data files here. There are 11 different files, so it takes some time getting familiar with their layout and to see which ones they used in the Upshot.
This post hopefully helps other folks navigate the data or offer me some insights into what you’ve found as you work through it. But here goes, I’ll replicate findings for Washington University in St. Louis and for California State University since these two got a lot of attention in the NYT article.
Replicating family income
According to Wash U’s Upshot page, the median family income of students is $272,000 and 84% come from the top quintile of the income distribution. To show just how lopsided their enrollments are in terms of economic diversity, consider this: about 22% of their student body comes from the top 1% of the income distribution, while less than 1% come from the bottom 20%!
Table 5 is where to find this data. Wash U’s identification number is “2520” and the Upshot uses the 1991 birth cohort, so be sure to restrict the panel to those criteria. These variables measure median parental household income (par_median_age20), along with the fraction of students enrolled by income quintile (par_q5_age20 and par_q1_age20) and top 1% (par_top1pc_age20) according to where the student was enrolled at age 20:
Replicating upward mobility rates
The Upshot also displays two different mobility rate metrics:
The first is “moving up two or more quintiles,” and about 9 in 100 students come from the bottom and end up at least two quintiles higher as adults (30-somethings).The Upshot calls this the overall mobility rate.
The second is the same rate used in the Chetty et al paper, which is “moved from the bottom to top income quintile.” About 1 in 100 students come from the bottom and end up at the top quintile of the income distribution.
If I had to choose one of these measures, I would prefer the first since upward mobility doesn’t always have to be a rags to riches story. Moving from the bottom 20% to the top 40% is still upward mobility and wouldn’t be captured in the second measure.
Table 2 is where to find this mobility rate data. The paper explains how mobility rate is calculated as the product of access (fraction of students from bottom income quintile) and success rate (fraction of such students who reach the top income quintile as adults).
In the data, it’s easy to get bottom-to-top mobility rates (mr_kq5_pq1) that are used in the paper. But if you want to measure overall mobility (the first definition above), then you need to jump through some hoops — unless I overlooked a variable that does this already. You have to calculate each of the six possible ways a child can jump up two income quintiles: they can go from the bottom to the top three, or from the second-lowest to the top two, or from the third-lowest to the top.
Between Tables 2 and 5, you can pretty easily replicate some of the main data elements of the Upshot page. It took a little bit of a learning curve to search across all these files and figure out which variable to use and when, but hopefully this brief discussion helps validate your efforts if you’re trying to use this data for research. And of course, if you see I missed something, please let me know!
Using this data for research
Now that we know how to extract two different mobility rates and the fraction of students from various income quintiles for each college, we might be inclined to use this data in our own research. There is still a lot to learn about this data and it will take time to fully understand the strengths, limitations, and opportunities this dataset provides researchers. It’s a massive amount of information generated from sources that haven’t been used to date. So researchers will have a learning curve and I know I’m still trying to make sense of what’s in here and how it might be used for research. Here are a few helpful things I’m still working through:
1) Parent-child relationships
Each student is connected to a college via the 1098-T tax form and NSLDS Pell Grant reports. Colleges must report tuition payments for all students using the 1098-T form, and if a student paid no tuition the NSLDS record picks them up. The tax form includes the employer ID number (EIN) corresponding to where the student paid tuition, creating a “near complete roster of college attendance at all Title IV institutions in the US,” which is remarkable.
However, this does not mean the college where the student enrolled is available in the dataset. In Table 11, Chetty et al begin with 5,903 institutions. About 2,960 of these colleges have “insufficient data” to report in the final analysis. Another 576 colleges end up getting clustered with at least one more institution.
For the University of Wisconsin, all 13 public four-year universities and UW Colleges (the system’s community colleges) are all lumped together as a single observation. Indiana University, University of Pittsburgh, University of Massachusetts, University of Maine, University of Maryland, University of Minnesota, University of South Carolina, West Virginia University, Miami-Dade Community College, the University of Tennessee, and several more colleges are in a similar boat as Wisconsin: the data does not reflect individual institutions. Considering the heterogeneity within systems, these system-level mobility rates will not reflect the mobility rate of each individual campus.
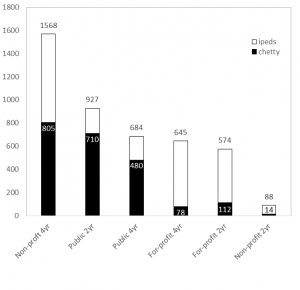
Here’s a better way to see it. Below is the total number of institutions (this time using unitid from IPEDS) by each sector. Two-year colleges include those that offer less-than two-year degrees. All are Title IV degree-granting institutions. Mapping Chetty et al’s data to this, we can see the data captures about 480 out of 684 (70%) public four-year universities but only half of non-profit (805 out of 1,568) and about 12% of for-profit four-year universities (78 of 645). Similar patterns occur in the two-year sector where about 77% of community/technical colleges are accounted for, but far lower rates in the private sectors:
It is hard to tell the extent to which this matters, and maybe it doesn’t if we ascribe to the “some data is better than no data” argument (which I’m pretty sympathetic to in this case). But about 3.17 million students attend a collapsed institution, which is about 20% of the nation’s total enrollment. So given “University of Wisconsin System’s” bottom-to-top mobility rate of <1% and its overall mobility rate of 13%, I don’t know how to interpret this finding. Are the results driven by Madison’s campus? Milwaukee? Any of the others?
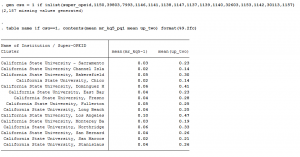
Let’s take the Cal State system as an example. Each campus is listed separately in the Chetty database and their mobility rates (bottom-to-top and overall) are below:
We can see here the range of overall upward mobility (the right column) ranges from a low is 14% at CSU-Channel Islands to a high of 47% at CSU-Los Angeles. This is quite a bit of variation within a single system. If I lump these 15 universities together into “Cal State System” then our overall upward mobility score would be 26%, which doesn’t represent either campus’ experience very well:
All of this is to say: be cautious working with parent-child relationships and realize this study only looks at about half of all colleges in the U.S. (depending on how we classify them).
2) Transfer and enrollment
The research team had to make some tough decisions about how to link students to their college. With nearly 40% of freshmen transferring within six years, should a student be matched to their original institution, the one they attended most often, the one they last enrolled in, or the one they earned a degree from? The paper and data files focus on the most-often attended college and the college last-attended at age 20 (they don’t give a lot of details, so you really have to read between the lines with some of this).
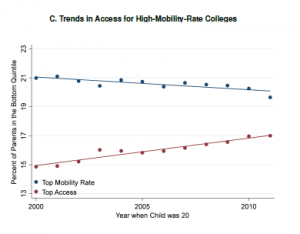
It is unclear whether or why one institution should be credited for upward mobility if their students attended multiple colleges. It is also unclear what mechanisms are at play when a student experiences upward mobility simply by attending (not completing) a college. Yet, that’s exactly what this study concludes — simply enrolling yields upward mobility. I don’t know how to make sense of this quite yet, but I found Figure IXC to be provocative. Despite the upward mobility gains documented throughout the paper, this figure shows how fewer low-income students are enrolling in high-mobility-rate colleges. The downward-sloping line shows how access is slowly (and shallowly) falling at the colleges that seem to be doing the best in terms of advancing opportunity. Again, I haven’t wrapped my head fully around this, but it’s certainly stuck in my head when thinking about where this trend is heading:
3) Graduation rates
The paper and data files do not address or measure degree attainment. All the mobility gains discussed in the NYT and elsewhere are associated with attending, not completing, college.
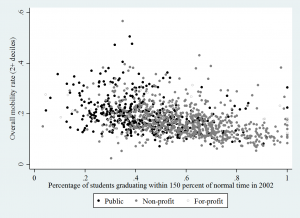
We can look at the correlation between each college’s graduation rate (from Table 10) and merge this with the mobility data (Table 2) and see another side of the story the authors tell in the paper: broad-access institutions (which often have low graduation rates) are those that have the highest upward mobility. Below uses the “up two income deciles” measure of mobility and only looks at four-year institutions, but the negative relationship is pretty clear — even if a college has a low graduation rate, they are correlated with having have high overall upward mobility rates.
I’m happy to share more about how I ran these descriptives, and of course please chime in or email me if you see that I’m overlooking something here. The data set is new and I’m still getting oriented. And in that process, I found it helpful to document some of the steps I took so other researchers interested in this data might be able to have a sounding board. Good luck and I’ll be looking forward to seeing how this data is used, interpreted, and otherwise dealt with in the future. It will take a bit of community learning in order to get up to speed on what we can and can’t do with this new treasure or truly remarkable data.

