The UW Colleges are a unique feature of the public higher education landscape. They are classified as “Associate’s: High-Transfer, High-Traditional” colleges, meaning they largely serve traditional-aged students (coming directly out of high school) with a goal of improving transfer from Associate’s to Bachelor’s degree programs.
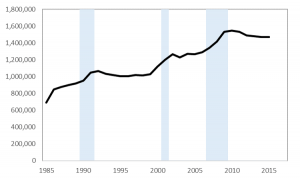
Nationwide, there are about 160 of these colleges* and they enroll about 1.5 million undergraduates. Since the end of the Great Recession, enrollments have dropped and today’s enrollments are higher than the pre-Recession levels.^
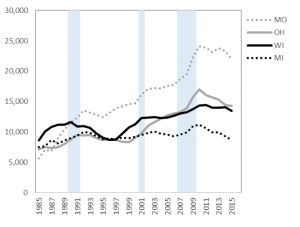
Colleges located in Midwestern states are experiencing similar enrollment declines since 2010, and the following chart shows the four largest Midwestern Higher Education Compact states’ total enrollments for their “high-transfer, high-traditional” Associate’s degree granting colleges:
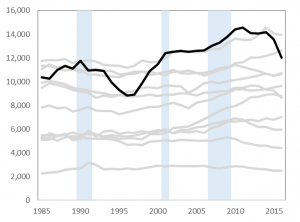
Using the UW System’s Accountability Dashboard, we can see how UW Colleges’ enrollment levels have changed relative to four-year universities in the system (this chart excludes UW-Madison and UW-Milwaukee). Approximately 12,000 students enrolled during the fall of 2016-17.**
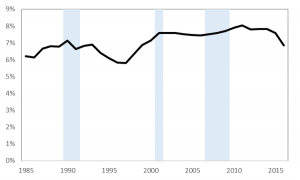
UW Colleges enrolled approximately 7 percent of the system’s total undergraduates in 2016-17 and this share has hovered between 6 and 8 percent over time.
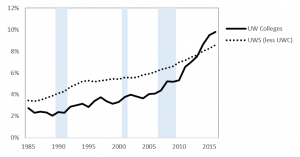
And a growing share of UW Colleges’ enrollments are from students who identify as Black, Hispanic, or Native American. Since 2010, the percentage of students classified into these three racial/ethnic groups has doubled within the UW Colleges.
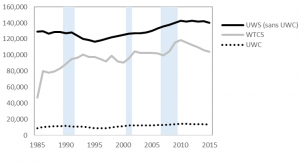
As conversations about UW Colleges continue, it is also worth stating these two-year institutions serve different missions than the Wisconsin Technical College System (WTCS). To oversimplify the difference, technical colleges are focused more on vocational training while UW Colleges focuses more on transfer. Nevertheless, the final chart uses IPEDS enrollment data to summarize how enrollments in the technical colleges, university system, and UW Colleges have changed over time.
Notes:
* A “college” could include multiple campuses. For example, UW Colleges is reported as a single institution in IPEDS, but accounts for 13 campuses and an online presence.
^ In all charts, we would get slightly different enrollment trends when using 12-month headcounts from IPEDS, but I used fall enrollment (undergraduate total, degree-seeking and non-degree-seeking).
** Note the axis scale on the previous chart makes the recent enrollment drop look less steep and the prior (IPEDS) data only includes 2015 enrollment, not 2016.
